Monitoring Docker containers using cAdvisor and Prometheus
Exploring cAdvisor + Prometheus + Grafana for Docker containers

In my previous blog series, Monitoring Kubernetes Cluster — Part I and Monitoring Kubernetes Cluster — Part II, We have implemented monitoring for the Kubernetes cluster. In the implementation, we have used Prometheus-Operator Helm 3 charts along with visualization tool Grafana.
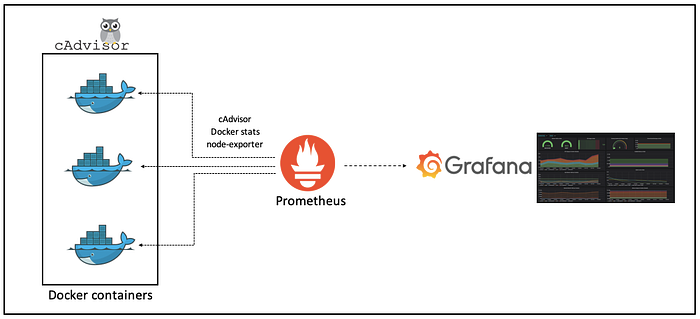
Now, in this blog, we are implementing monitoring for Docker containers using Docker images and with minimal settings.
New to Docker world?
There are overwhelming numbers of option available for container monitoring, We will be exploring following open-source options,
- Docker stats
- cAdvisor
- Prometheus + cAdvisor + Grafana
Docker stats :
Docker stats are available out of the box and it display’s a live stream of a container(s) resource usage statistics.
# docker stats [OPTIONS] [CONTAINER…]
$ docker stats
- CONTAINER ID and Name: the ID and name of the container
- CPU % and MEM %: the percentage of the host’s CPU and memory the container is using
- MEM USAGE / LIMIT: the total memory the container is using, and the total amount of memory it is allowed to use
- NET I/O: The amount of data the container has sent and received over its network interface
- BLOCK I/O: The amount of data the container has read to and written from block devices on the host
- PIDS: the number of processes or threads the container has created

cAdvisor :
cAdvisor (Container Advisor) provides container users an understanding of the resource usage and performance characteristics of their running containers. It is a running daemon that collects, aggregates, processes, and exports information about running containers. Specifically, for each container, it keeps resource isolation parameters, historical resource usage, histograms of complete historical resource usage and network statistics. This data is exported by container and machine-wide. cAdvisor has native support for Docker containers and should support just about any other container type out of the box.
Let’s now download cAdvisor and run it,
sudo docker run -d \
--volume=/:/rootfs:ro \
--volume=/var/run:/var/run:ro \
--volume=/sys:/sys:ro \
--volume=/var/lib/docker/:/var/lib/docker:ro \
--volume=/dev/disk/:/dev/disk:ro \
--publish=8080:8080 \
--name=cadvisor \
google/cadvisor:latest
We can check our containers along with resource usage information at — http://localhost:8080


GitHub: https://github.com/google/cadvisor
cAdvisor + Prometheus + Grafana :
New to Prometheus and Grafana,
First, clone GitHub repo — https://github.com/skynet86/docker-monitoring.git
now, copy Prometheus config file at /tmp/prometheus.yml. In this config file we config scraping targets for Prometheus. Here our targets are cAdvisor and node-exporter.
Let’s now download and run required containers,
# Run prometheus container
$ docker run -d --name prom -p 9090:9090 -v /tmp/prometheus.yml:/etc/prometheus/prometheus.yml  prom/prometheus:v2.14.0#Run Grafana container
$ docker run -d --name prom-dashboard -p 3000:3000 grafana/grafana:6.4.4#Run Node-Exporter container (for node metrics)
$ docker run -d --name node-exporter -p 9100:9100 prom/node-exporter
Prometheus — http://localhost:9090

Node Exporter — http://localhost:9100

Grafana — http://localhots:3000

For login into your Grafana, Use admin/admin (On your first login, you can skip password reset option if you want)
Now, add Grafana data source — Prometheus

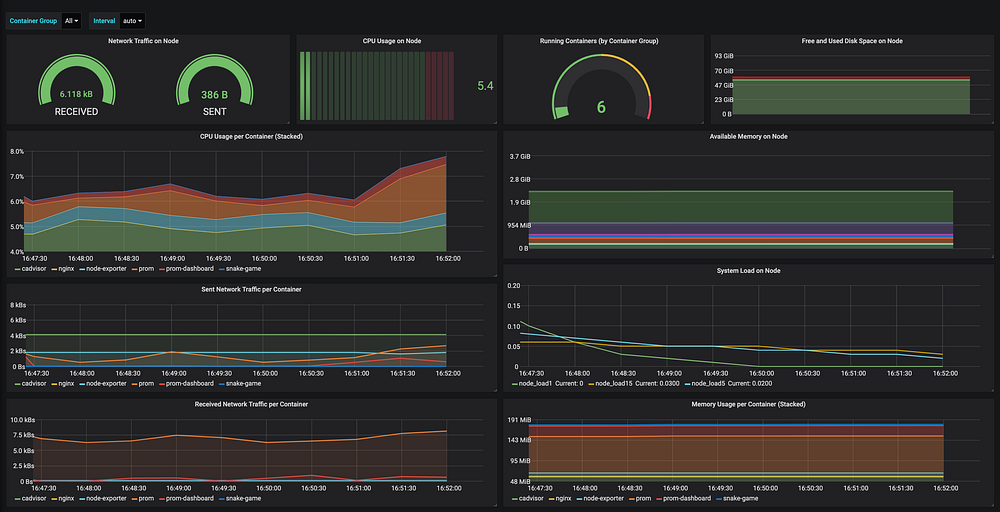
Now, Let's import a nice dashboard for our Grafana. You can either import it from Grafana Labs or you can use the JSON file. We will be using JSON which we have cloned from GitHub repo.
Import dashboard :


We have successfully imported metrics exposed by cAdvisor using Prometheus and we have created a nice dashboard for the same in Grafana.
Clean up :
# Delete containers
$ docker container rm -f prom prom-dashboard node-exporter cadvisor
# Delete images
$ docker image rm prom/prometheus:v2.14.0 grafana/grafana:6.4.4 prom/node-exporter google/cadvisor
I hope this will help you understand the basics of monitoring Docker containers. Have any questions? Ask in the comment.
